Logpush to Grafana Loki Endpoint Link to heading
Cloudflare Logpush can send logs to any HTTP Endpoint, with this project I want to configure Grafana Loki as a logging destination
To transform the incoming data from Logpush to a format Grafana Loki understands, I’m going to use a Worker to do the following:
- take incoming gzipped Logpush data, unpack it
- merge all fields into the Loki API format and send it off to the destination
This solution still requires transforming the data, but it can be done from Workers directly and does not require an intermediary storage location.
Create the Worker Link to heading
- create a new Worker with Cloudflare Wrangler
- update
wrangler.tomland change the type fromjavascripttowebpackas well as adding theusage_modeltounbound, examplewrangler.toml:
name = "cf-logpush-loki"
type = "webpack"

account_id = "abc1234"
workers_dev = true
route = ""
zone_id = ""
usage_model = "unbound"
- install the dependencies
npm install
- create an environment variable with the name
lokiHostand use your Loki Endpoint URL as the value:
wrangler secret put lokiHost
example Loki host: https://logs-prod-us-central1.grafana.net/loki/api/v1/push
- finally, let’s upload and publish the worker
wrangler publish
Note down the returned URL to create the actual Logpush job.
Create Logpush Job Link to heading
Here’s a cURL request to create a Logpush Job with most available fields already included:
curl --location --request POST 'https://api.cloudflare.com/client/v4/zones/<zone id>/logpush/jobs' \
--header 'X-Auth-Email: you@example.com' \
--header 'X-Auth-Key: abcSecretAPIKey' \
--header 'Content-Type: application/json' \
--data-raw '{
"name": "http",
"logpull_options": "fields=BotScore,BotScoreSrc,CacheCacheStatus,CacheResponseBytes,CacheResponseStatus,CacheTieredFill,ClientASN,ClientCountry,ClientDeviceType,ClientIP,ClientIPClass,ClientRequestBytes,ClientRequestHost,ClientRequestMethod,ClientRequestPath,ClientRequestProtocol,ClientRequestReferer,ClientRequestURI,ClientRequestUserAgent,ClientSSLCipher,ClientSSLProtocol,ClientSrcPort,ClientXRequestedWith,EdgeColoCode,EdgeColoID,EdgeEndTimestamp,EdgePathingOp,EdgePathingSrc,EdgePathingStatus,EdgeRateLimitAction,EdgeRateLimitID,EdgeRequestHost,EdgeResponseBytes,EdgeResponseCompressionRatio,EdgeResponseContentType,EdgeResponseStatus,EdgeServerIP,EdgeStartTimestamp,FirewallMatchesActions,FirewallMatchesRuleIDs,FirewallMatchesSources,OriginIP,OriginResponseBytes,OriginResponseHTTPExpires,OriginResponseHTTPLastModified,OriginResponseStatus,OriginResponseTime,OriginSSLProtocol,ParentRayID,RayID,SecurityLevel,WAFAction,WAFFlags,WAFMatchedVar,WAFProfile,WAFRuleID,WAFRuleMessage,WorkerCPUTime,WorkerStatus,WorkerSubrequest,WorkerSubrequestCount,ZoneID×tamps=unixnano",
"destination_conf": "https://your.example.workers.dev?header_Authorization=Basic%20dXNlcm5hbWU6cGFzc3dvcmQK&job=lokiJobName",
"max_upload_bytes": 5000000,
"max_upload_records": 1000,
"dataset": "http_requests",
"frequency": "high",
"enabled": true
}'
- Please make sure to update the following fields in the curl request above:
- your own zone ID instead of
<zone id> - your own API Key and/or E-Mail and Global API Key
- You might want to update the
logpull_options(check API Docs) - destination_conf enter your own workers domain in there, but keep the
?header_Authorization=Basic%20, just update theAuthorizationheader with your own username and password - Update the job query string to the stream name you want to see in Grafana later on.
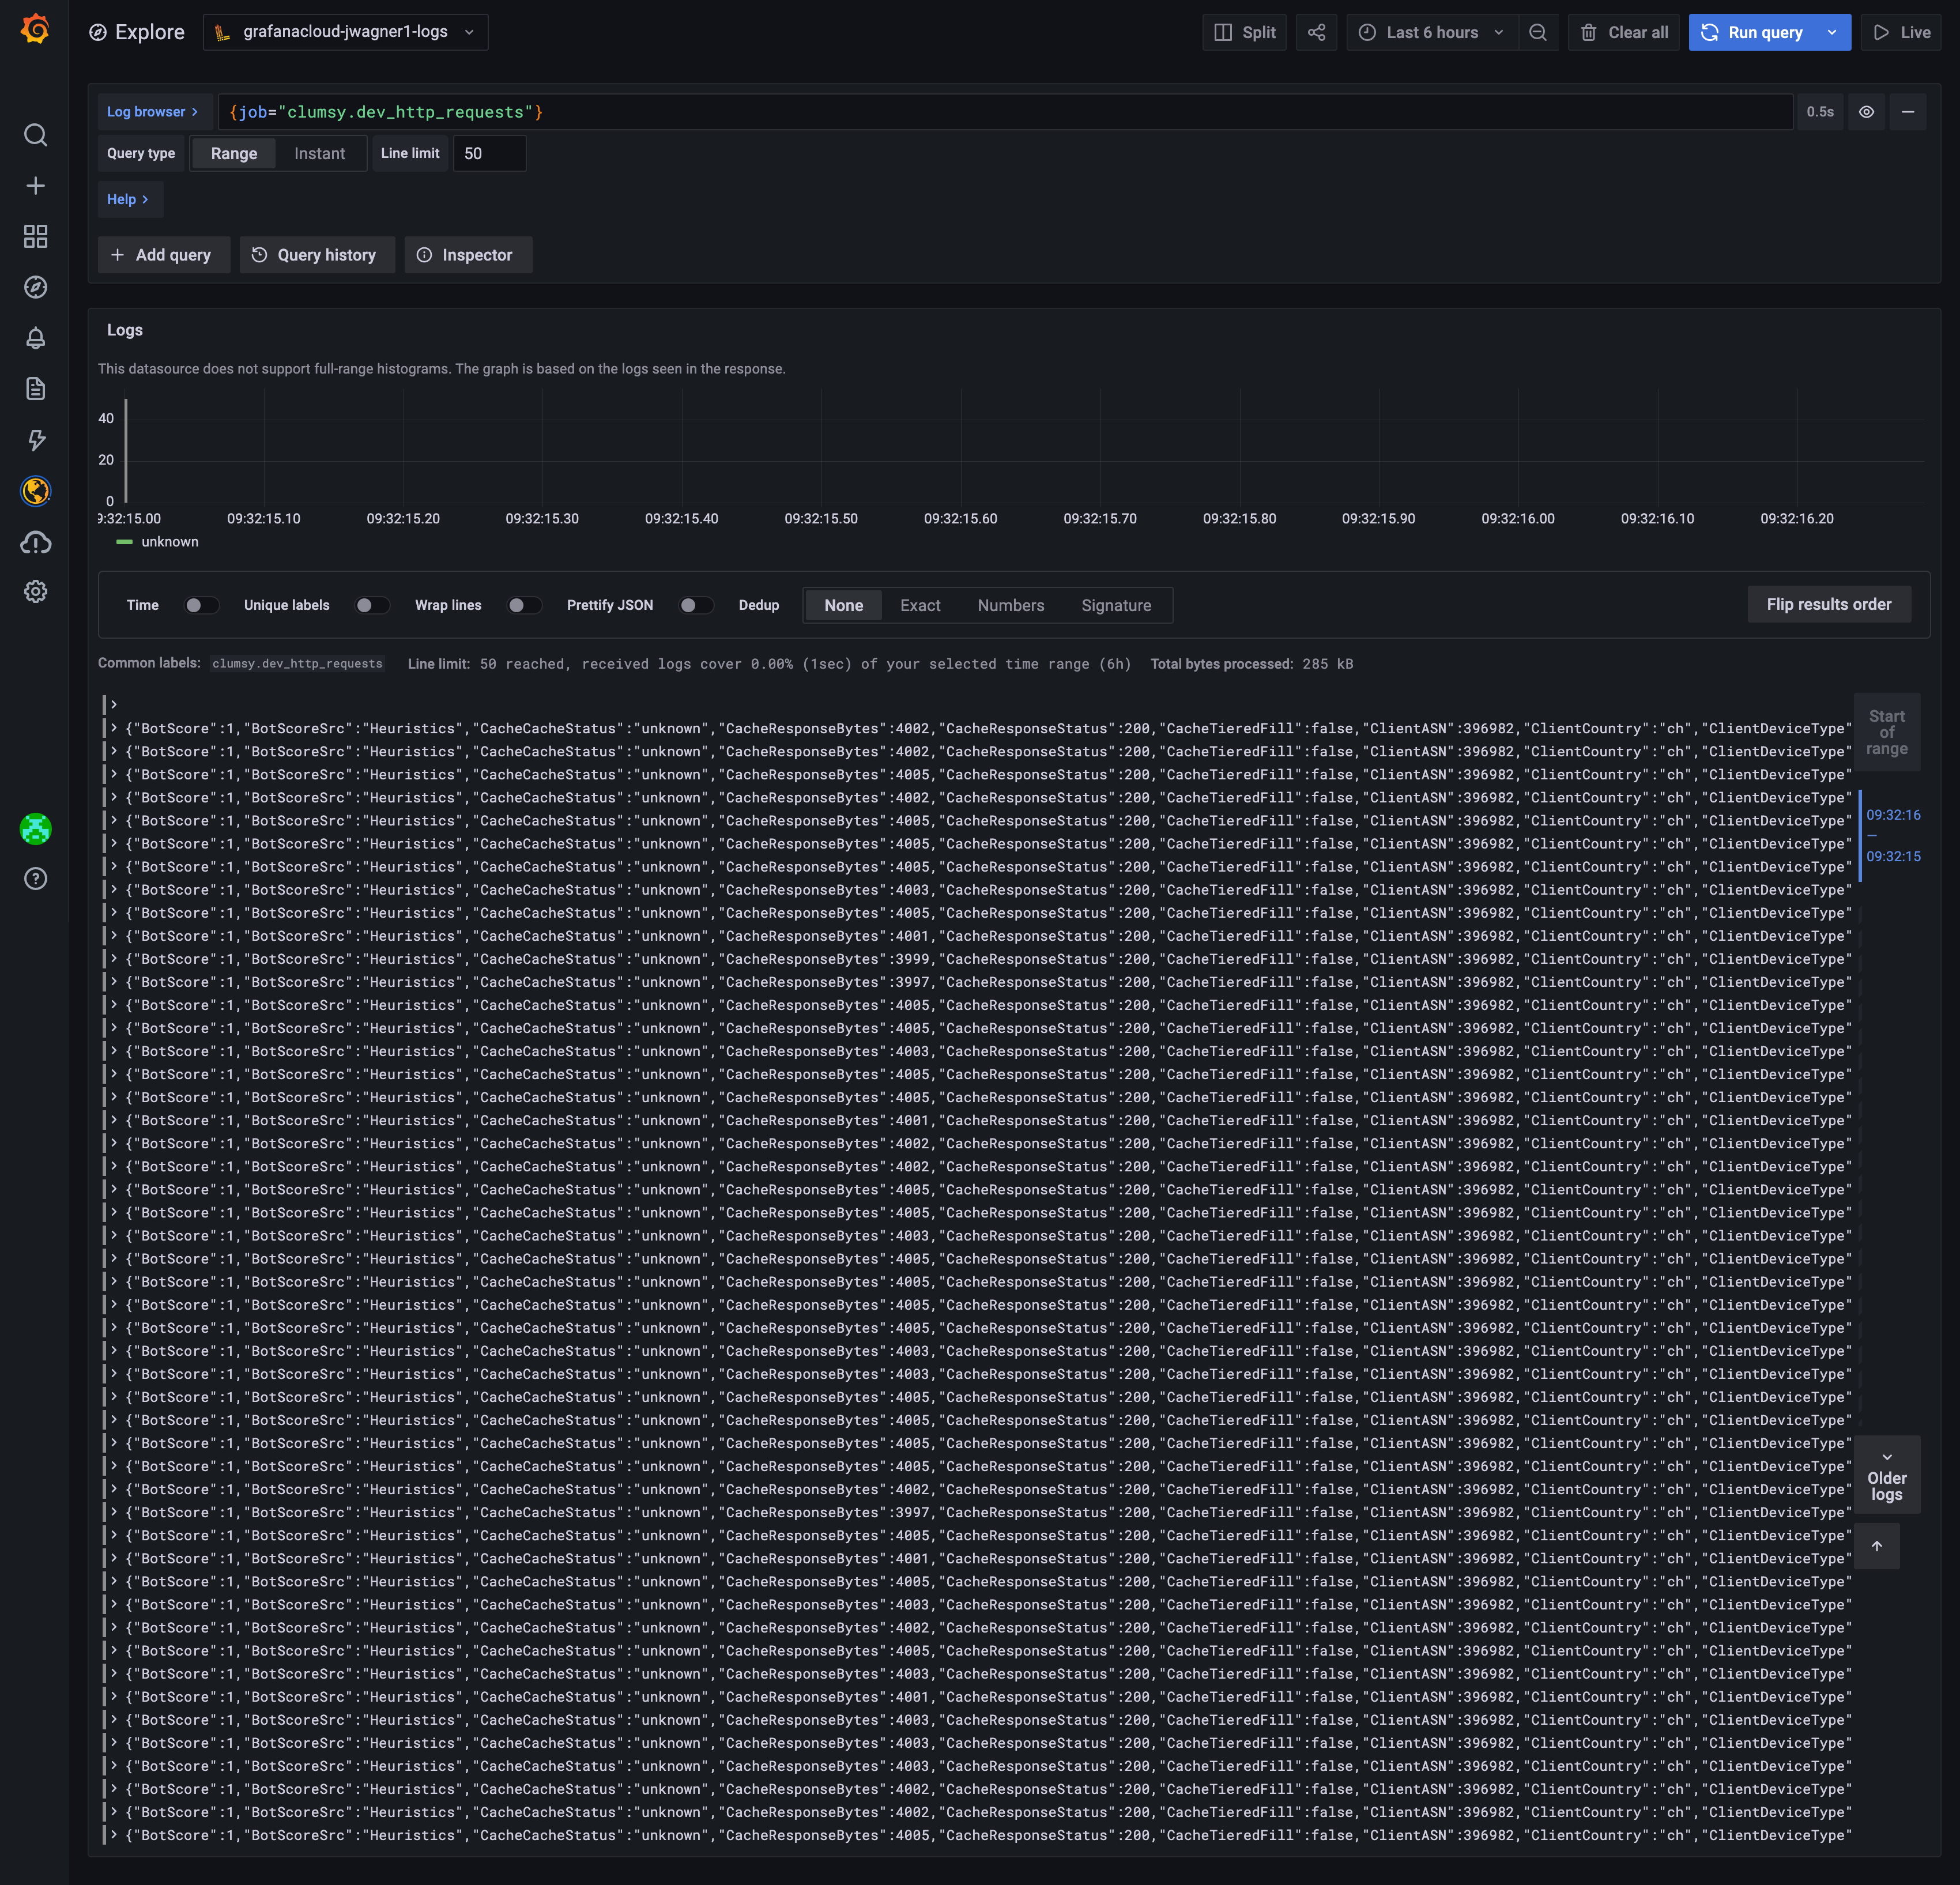
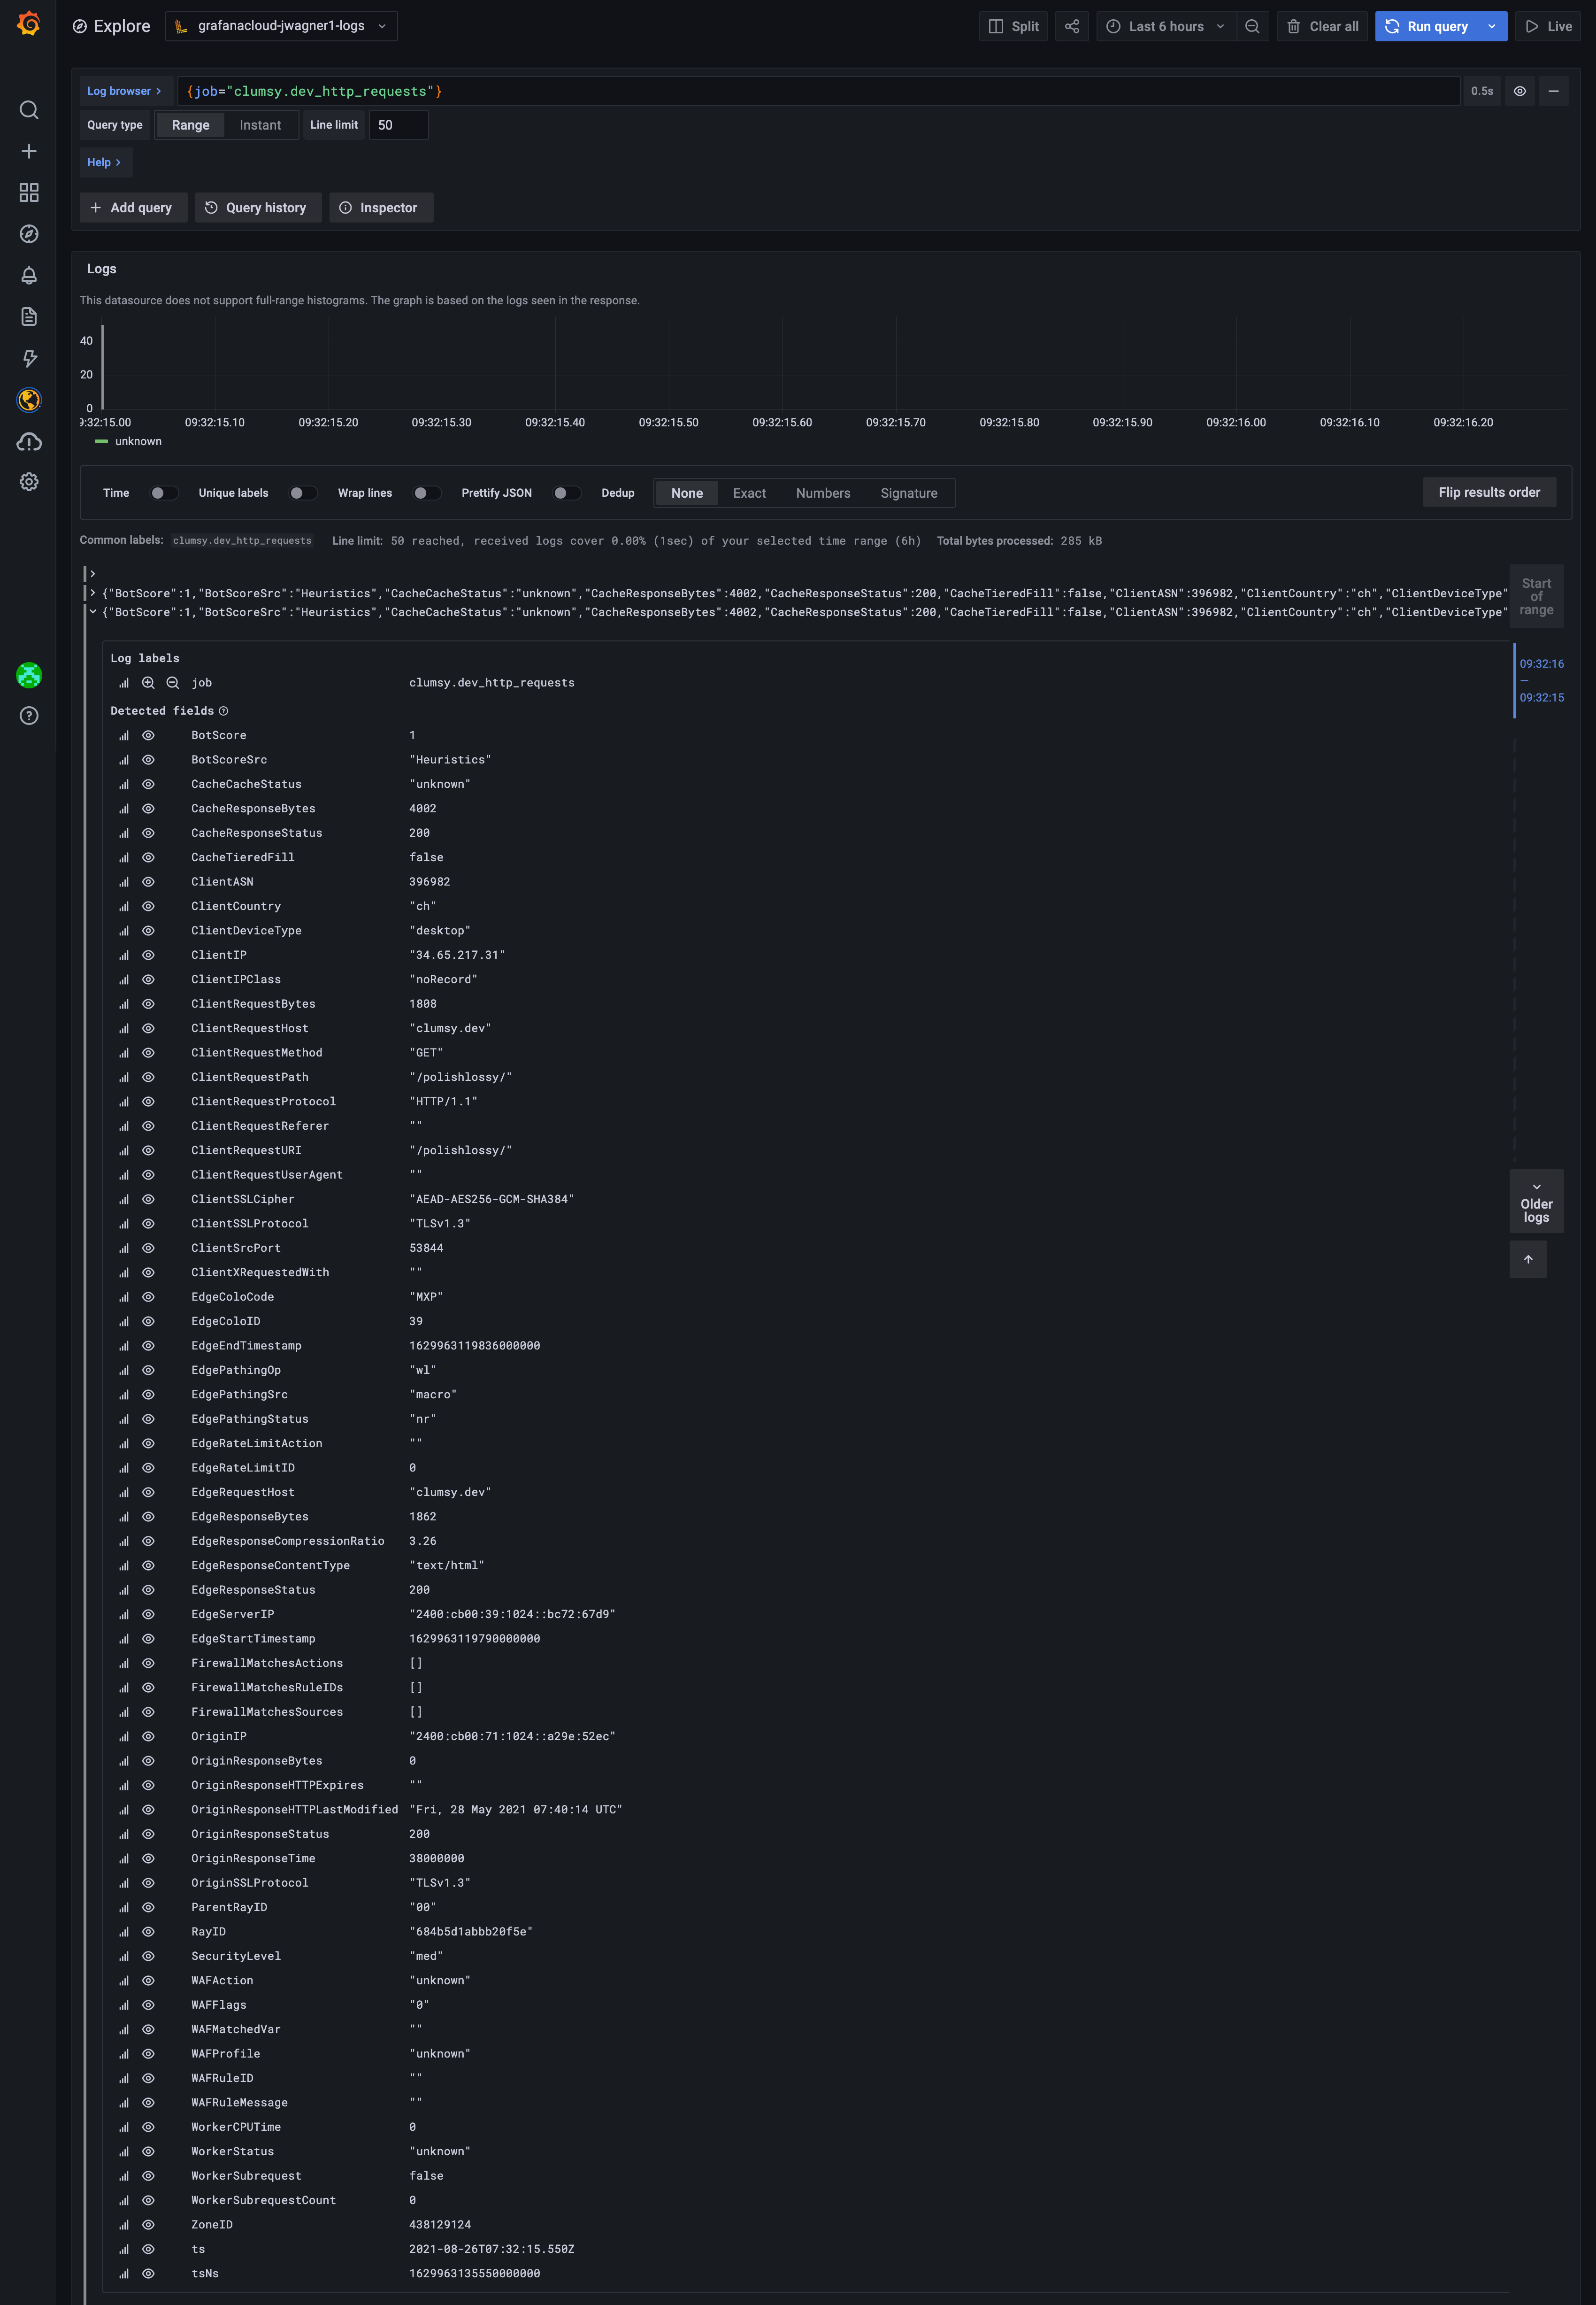
If everything went according to plan, you should see your new Logpush Job in the Analytics => Log tab as well as in Grafana Loki.
Debugging Link to heading
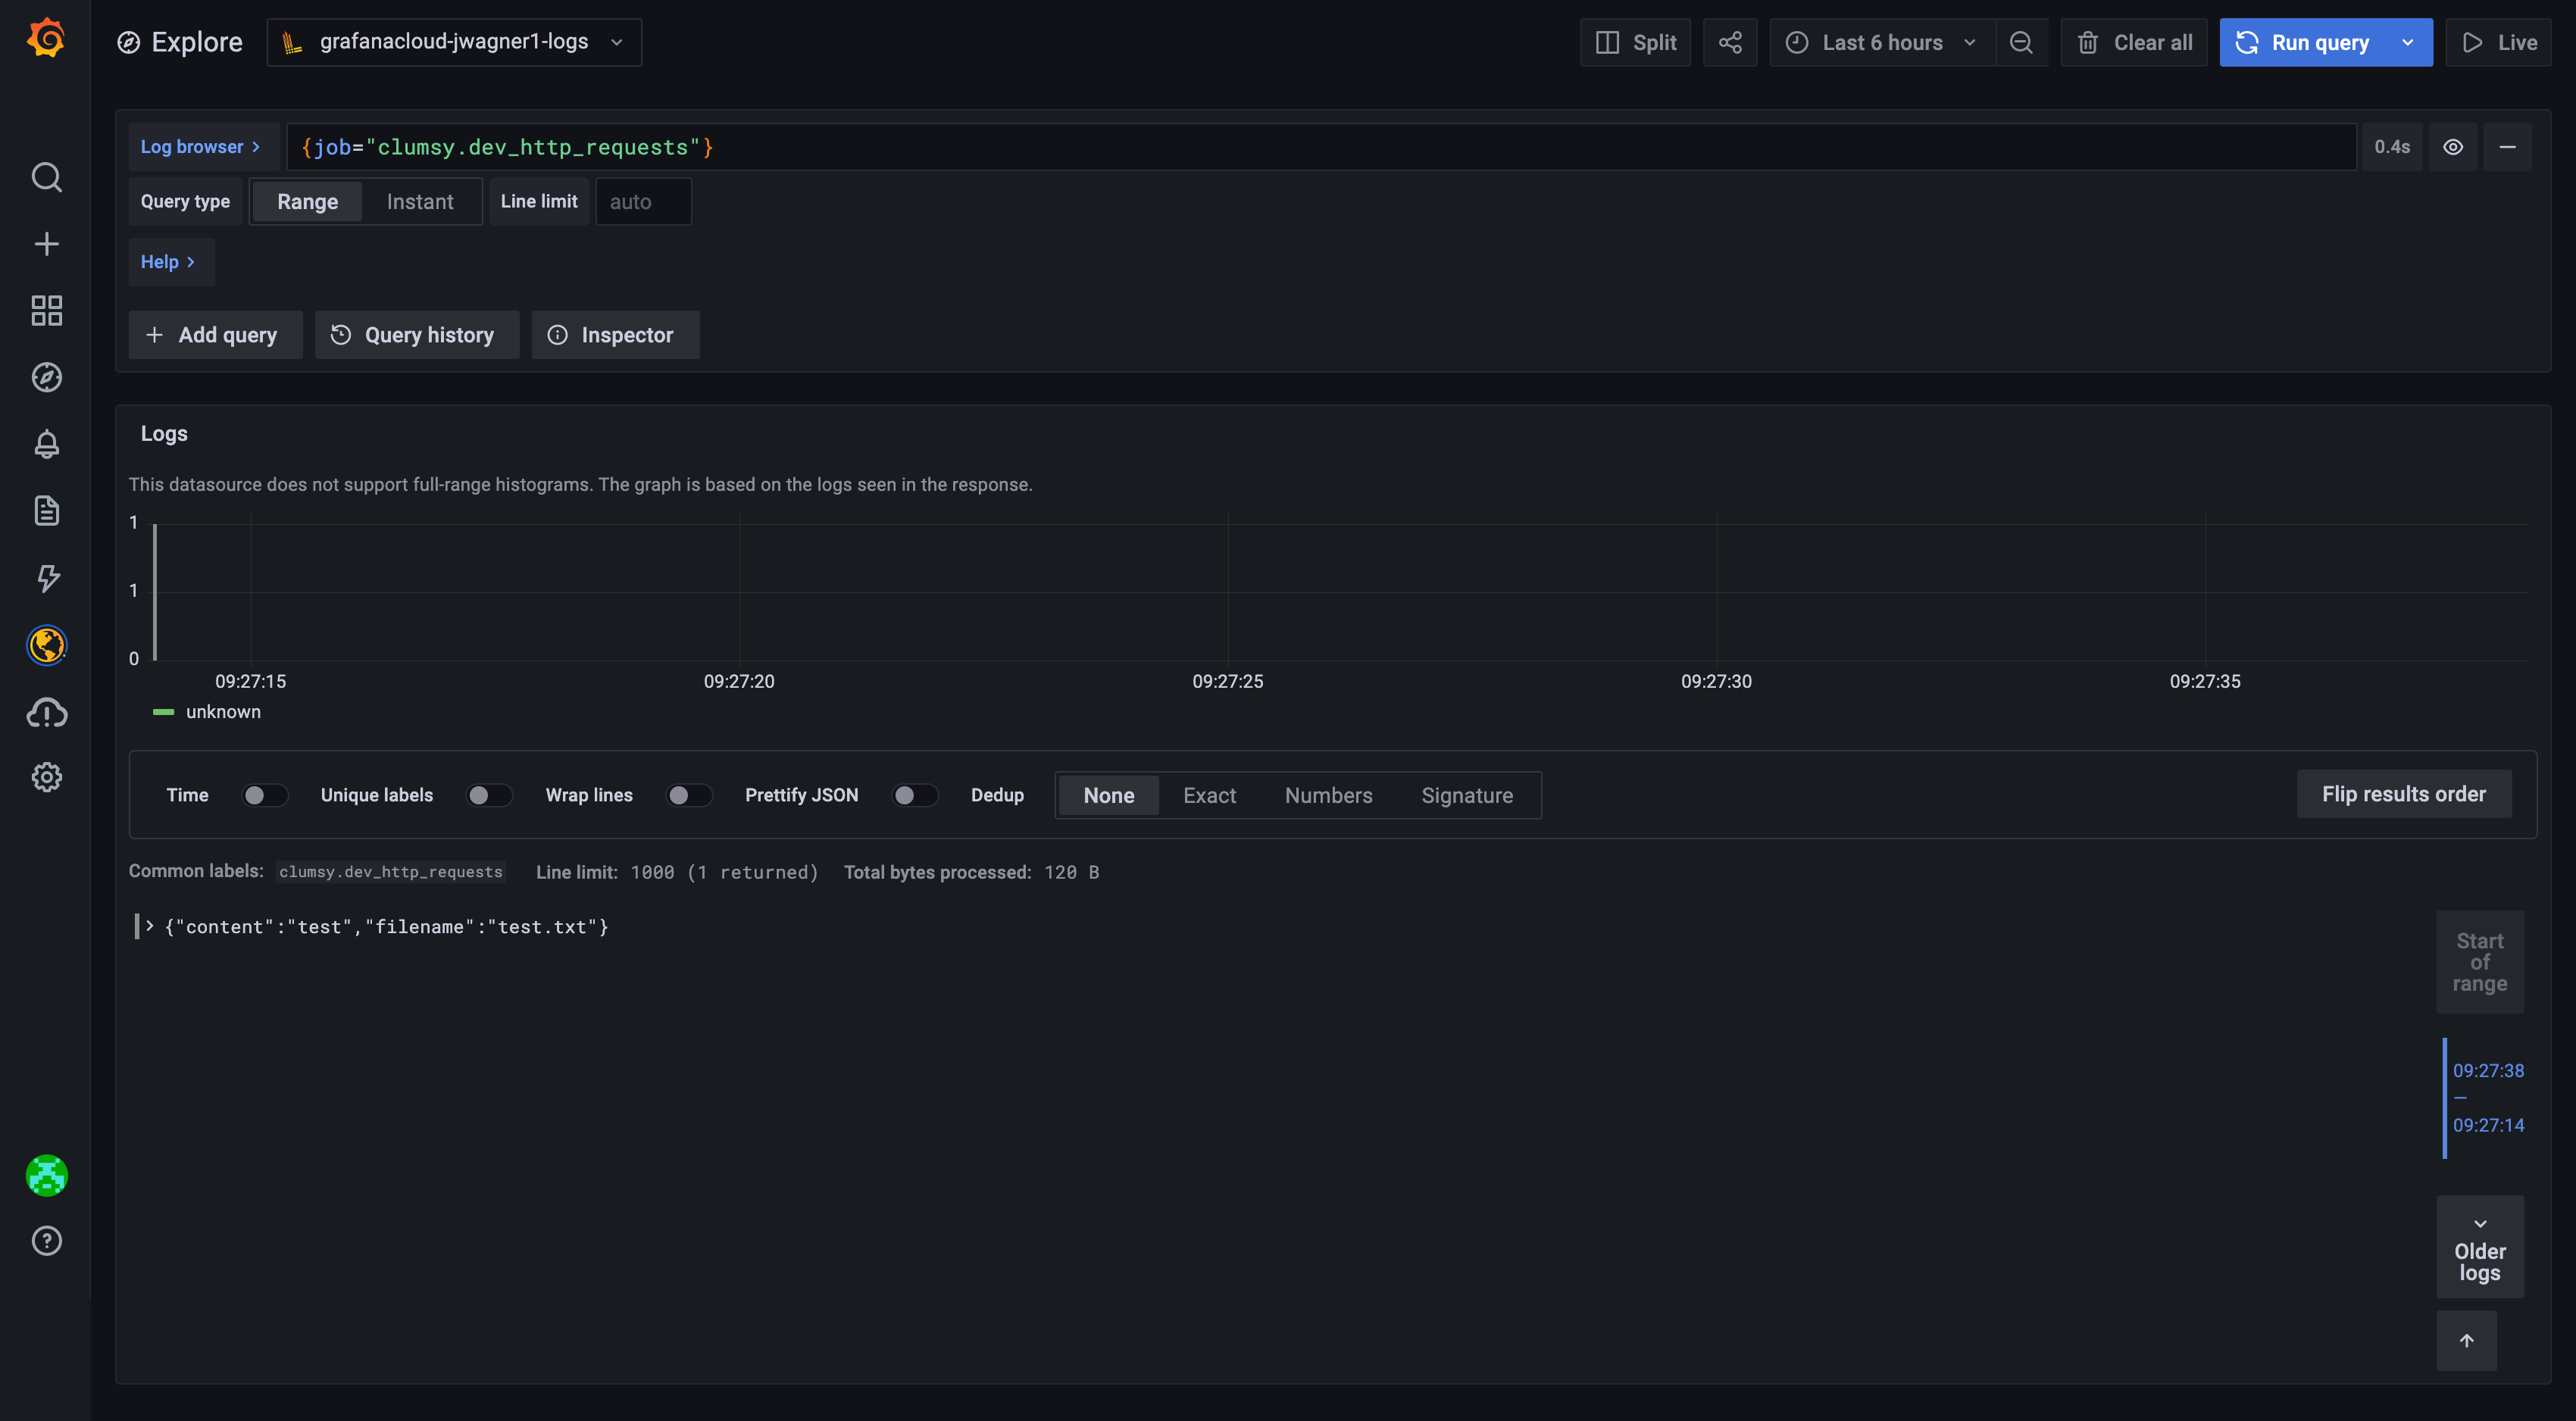
The initial creation of the Logpush job will push one JSON line to Loki, you should see something along the lines:
{"content": "test", "filename": "test.txt"}
In your Loki logs.